

Design Brief
Create a web interface with the following requirements.
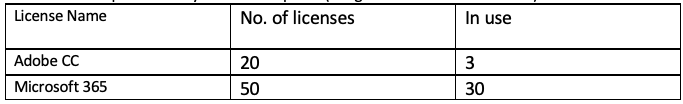
A user can upload a file that they have exported from another system.
This file will contain information about their software licenses: name of license, number of licenses they own and number of people who are using the licenses.
Graphically represent this information in a manageable way for the user to understand which licenses are not being used and how many they have.
Here is an example file that you have to upload (imagine there are 10 - 20 lines)
Process
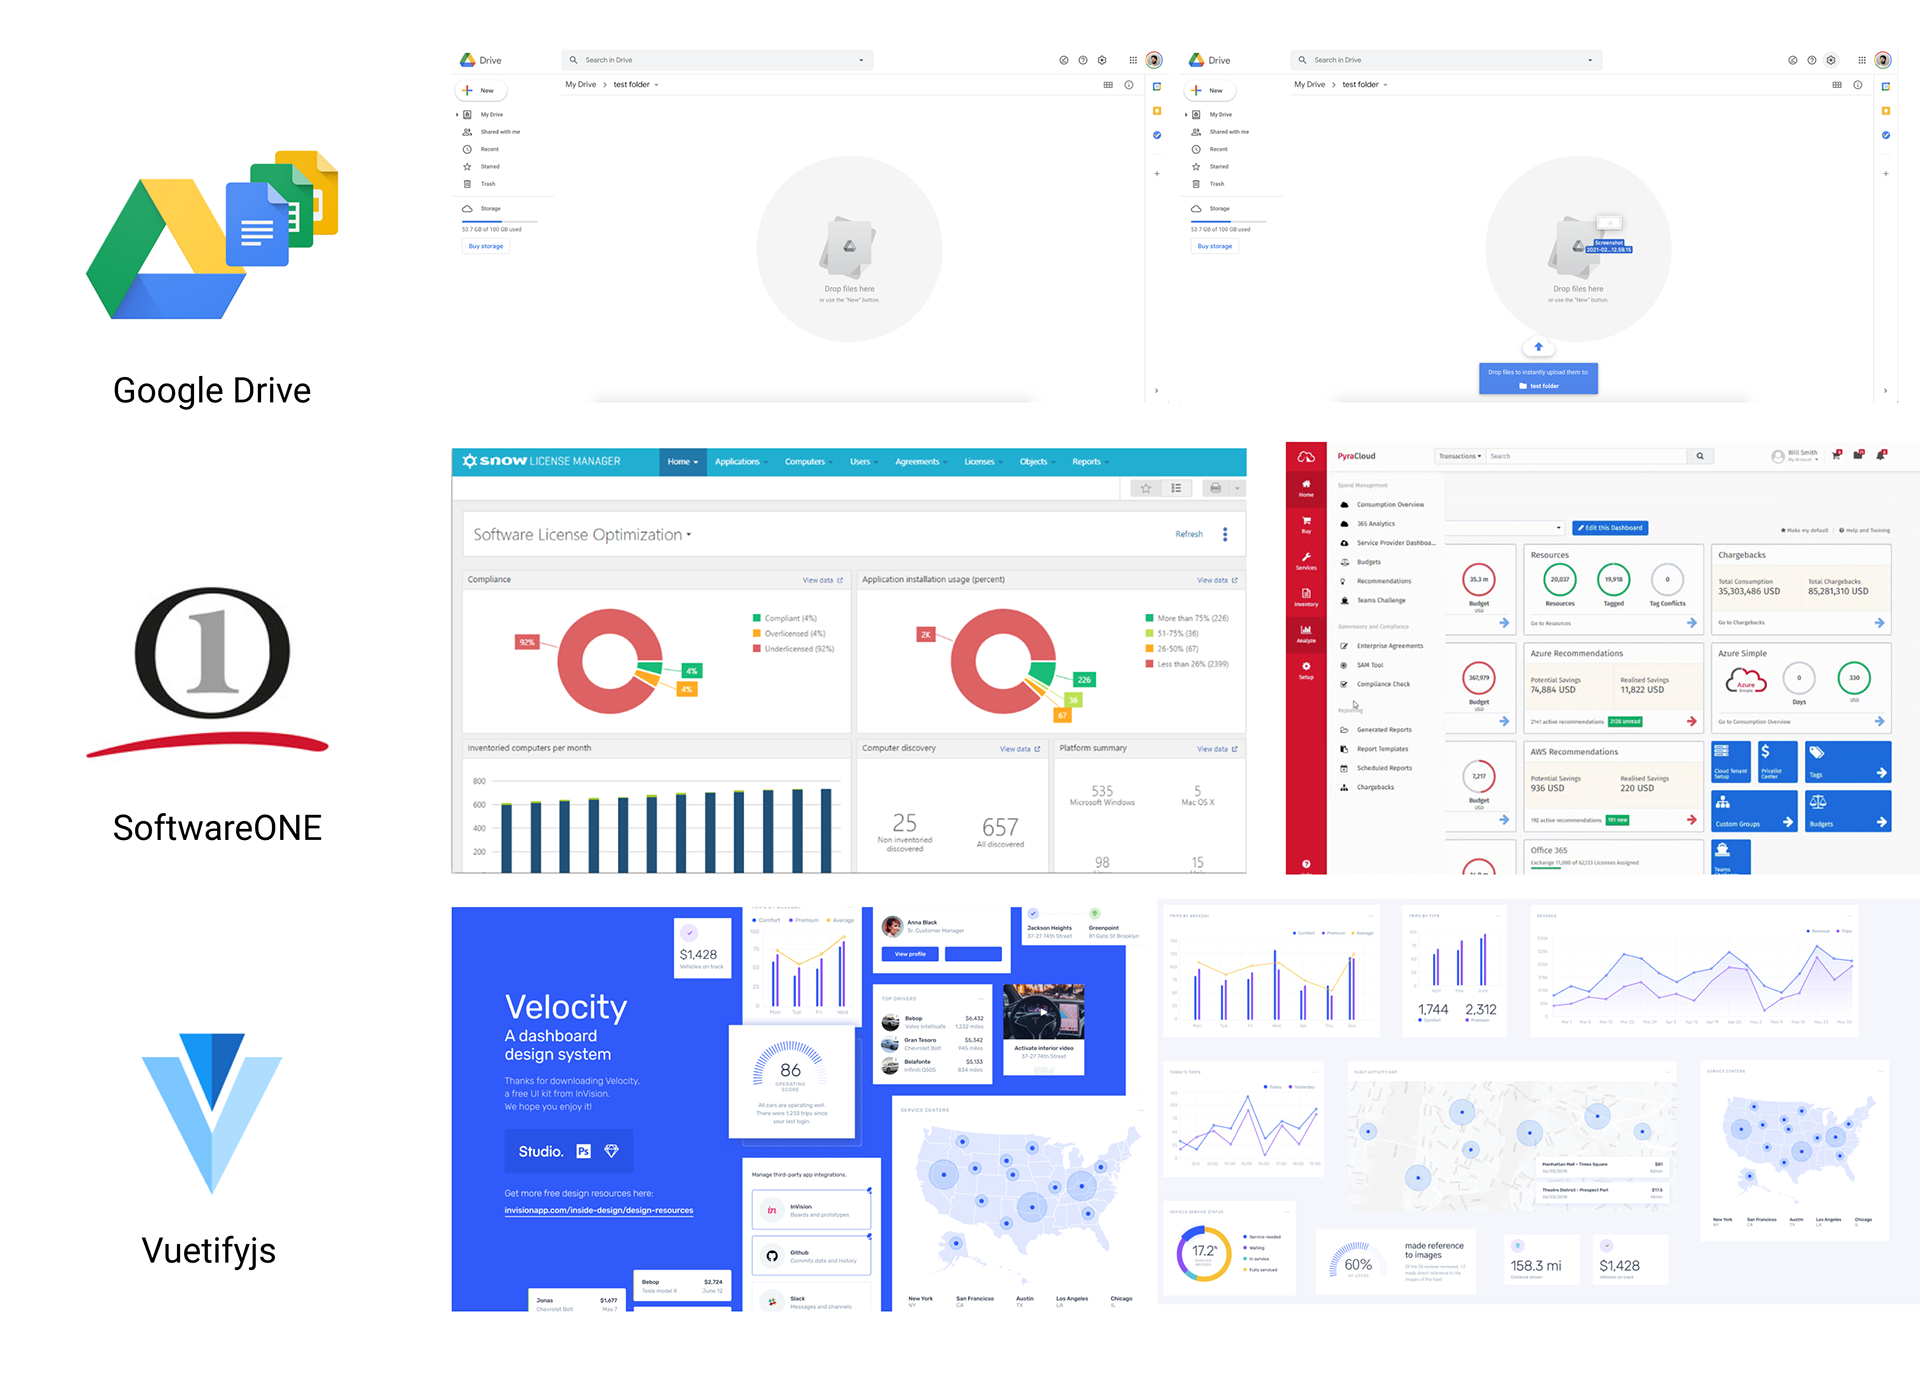
a) Inspiration Board
b) Basic user story development
c) Other assumptions made
d) Wireframe development
e) Prototype
f) Frames presentation
g) Enhancements
Inspiration board
User Story Development
By describing the desired outcome of a product feature, a user story reminds everyone involved what the user’s goals are. But most importantly, it allows myself, the designer, to visualise the functionality of a product and helps organise and prioritise the way each function is designed. Used at an early stage of the design process, this is a quick way to empathise with the users when designing a product that has multiple features.
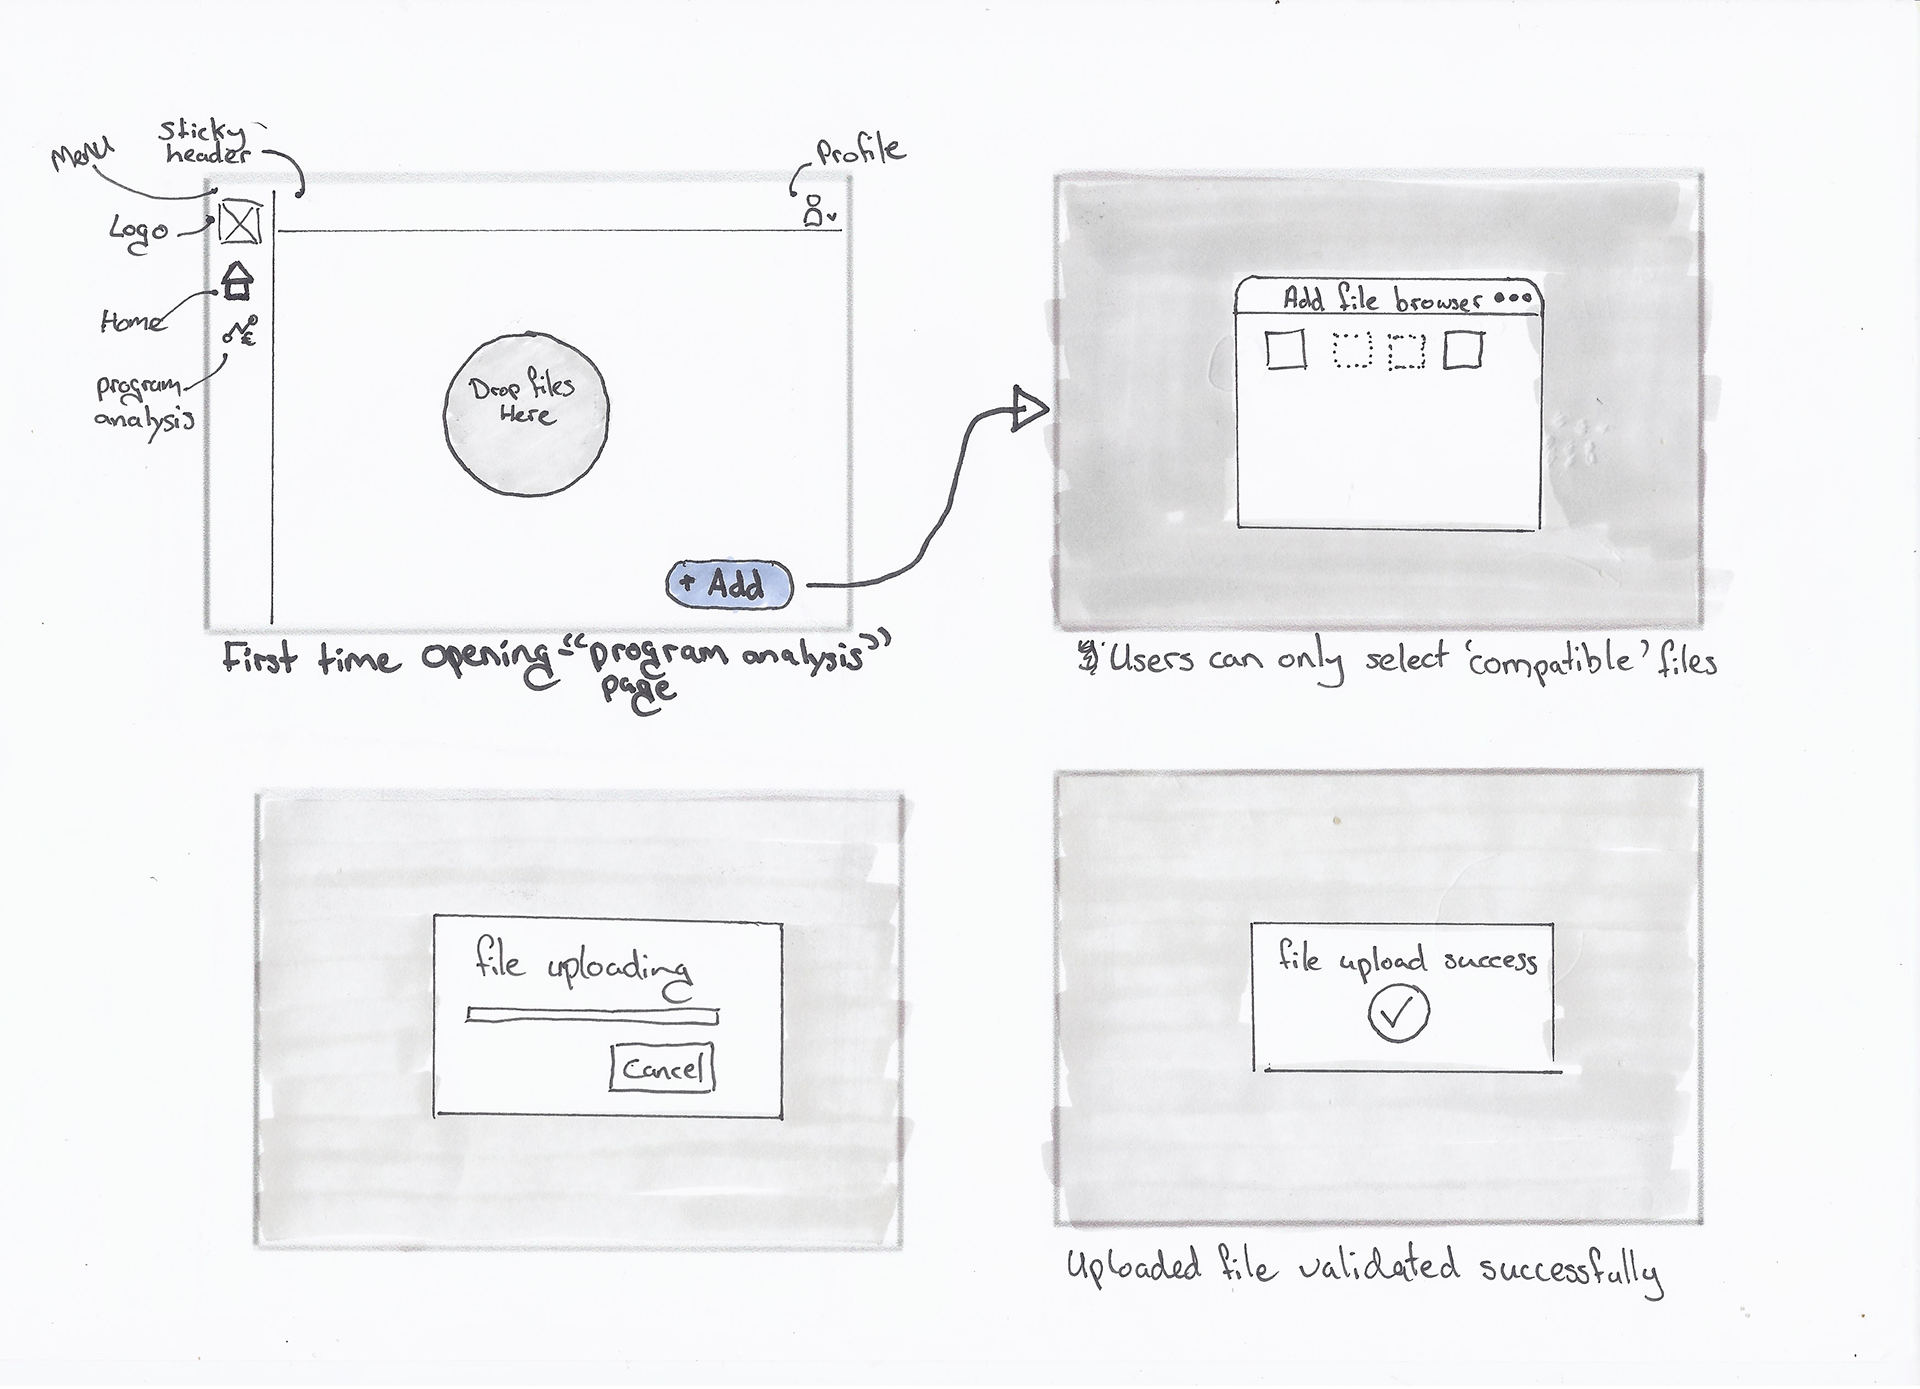
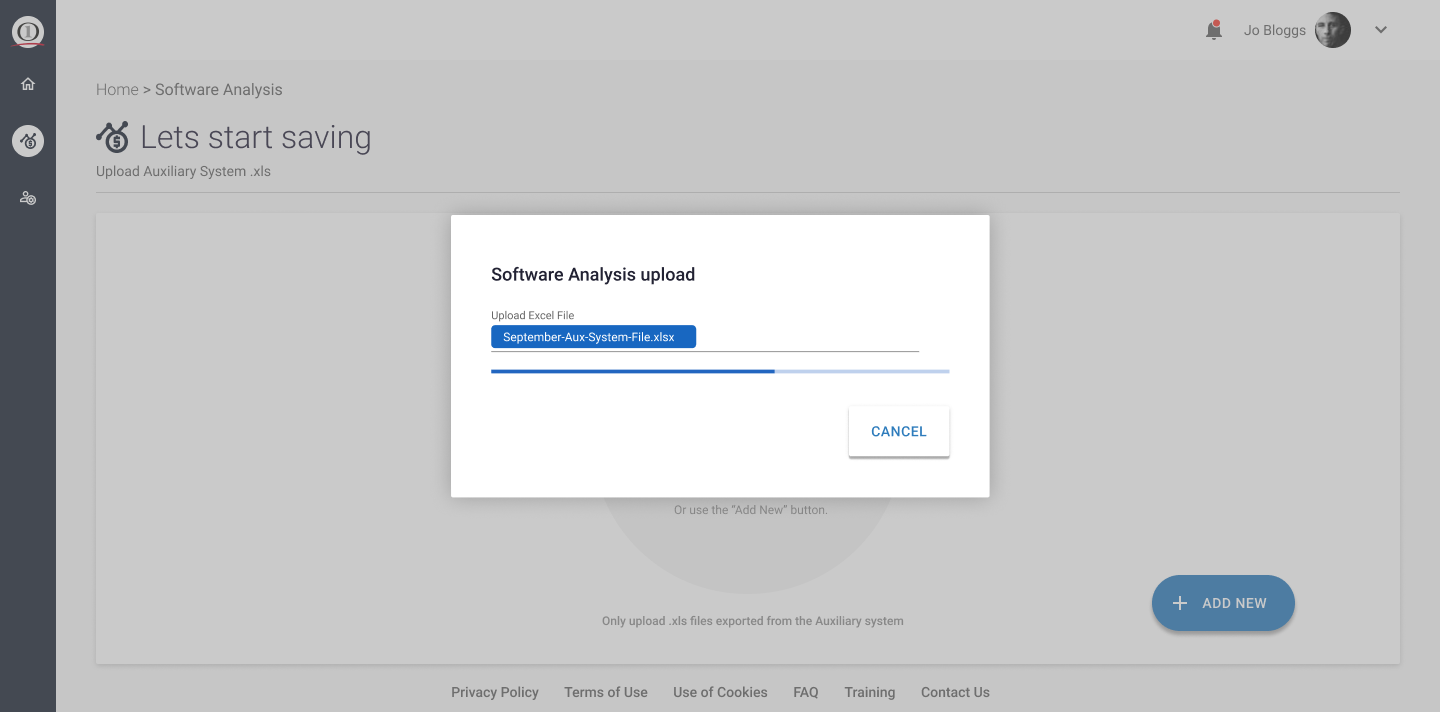
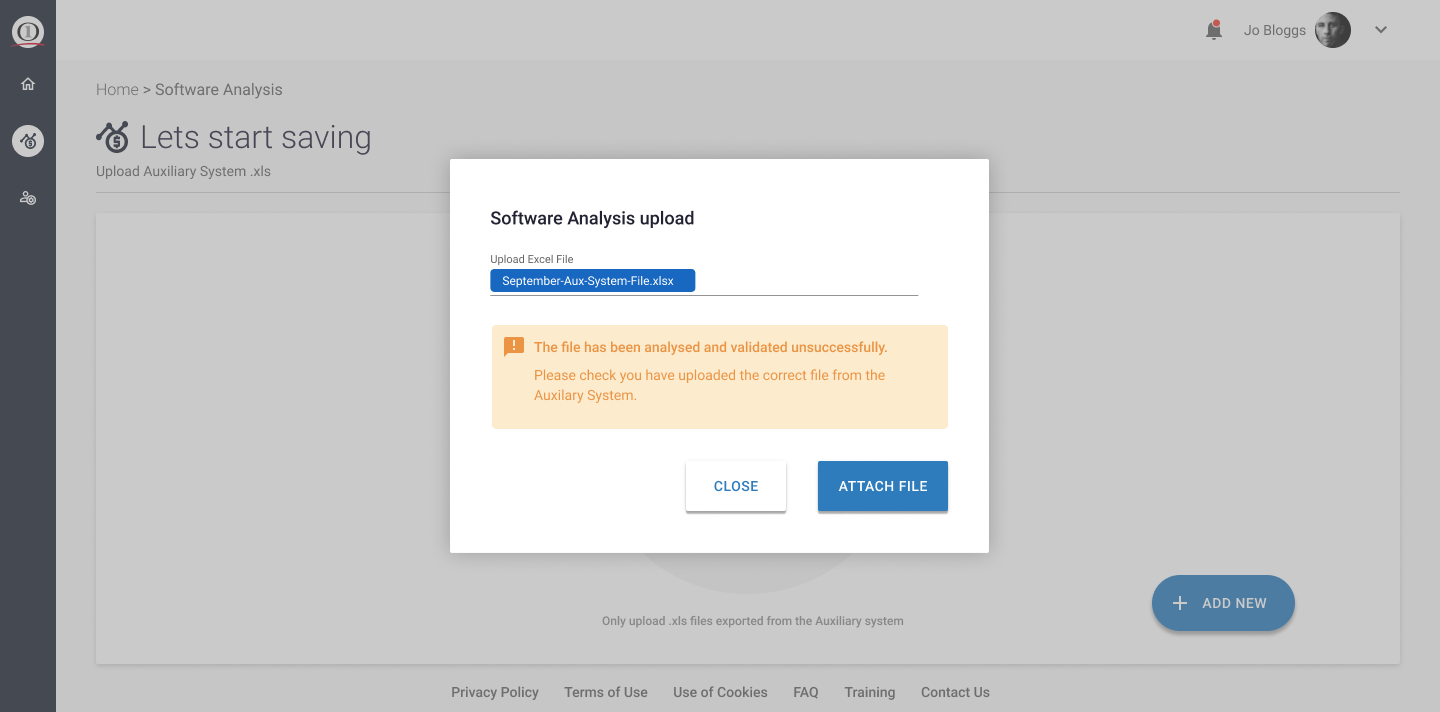
User Story 1 - As an IT Leader I want to be able to upload a .xls file using an Analysis Dashboard. Assume this an error free file (no blank fields, incorrect format, etc). Feedback to the user about the successful upload is needed. Another assumption is that users cannot upload the wrong file format as the file browser will only display the files that are ‘readable by the system’ making picking the file as easy as possible.
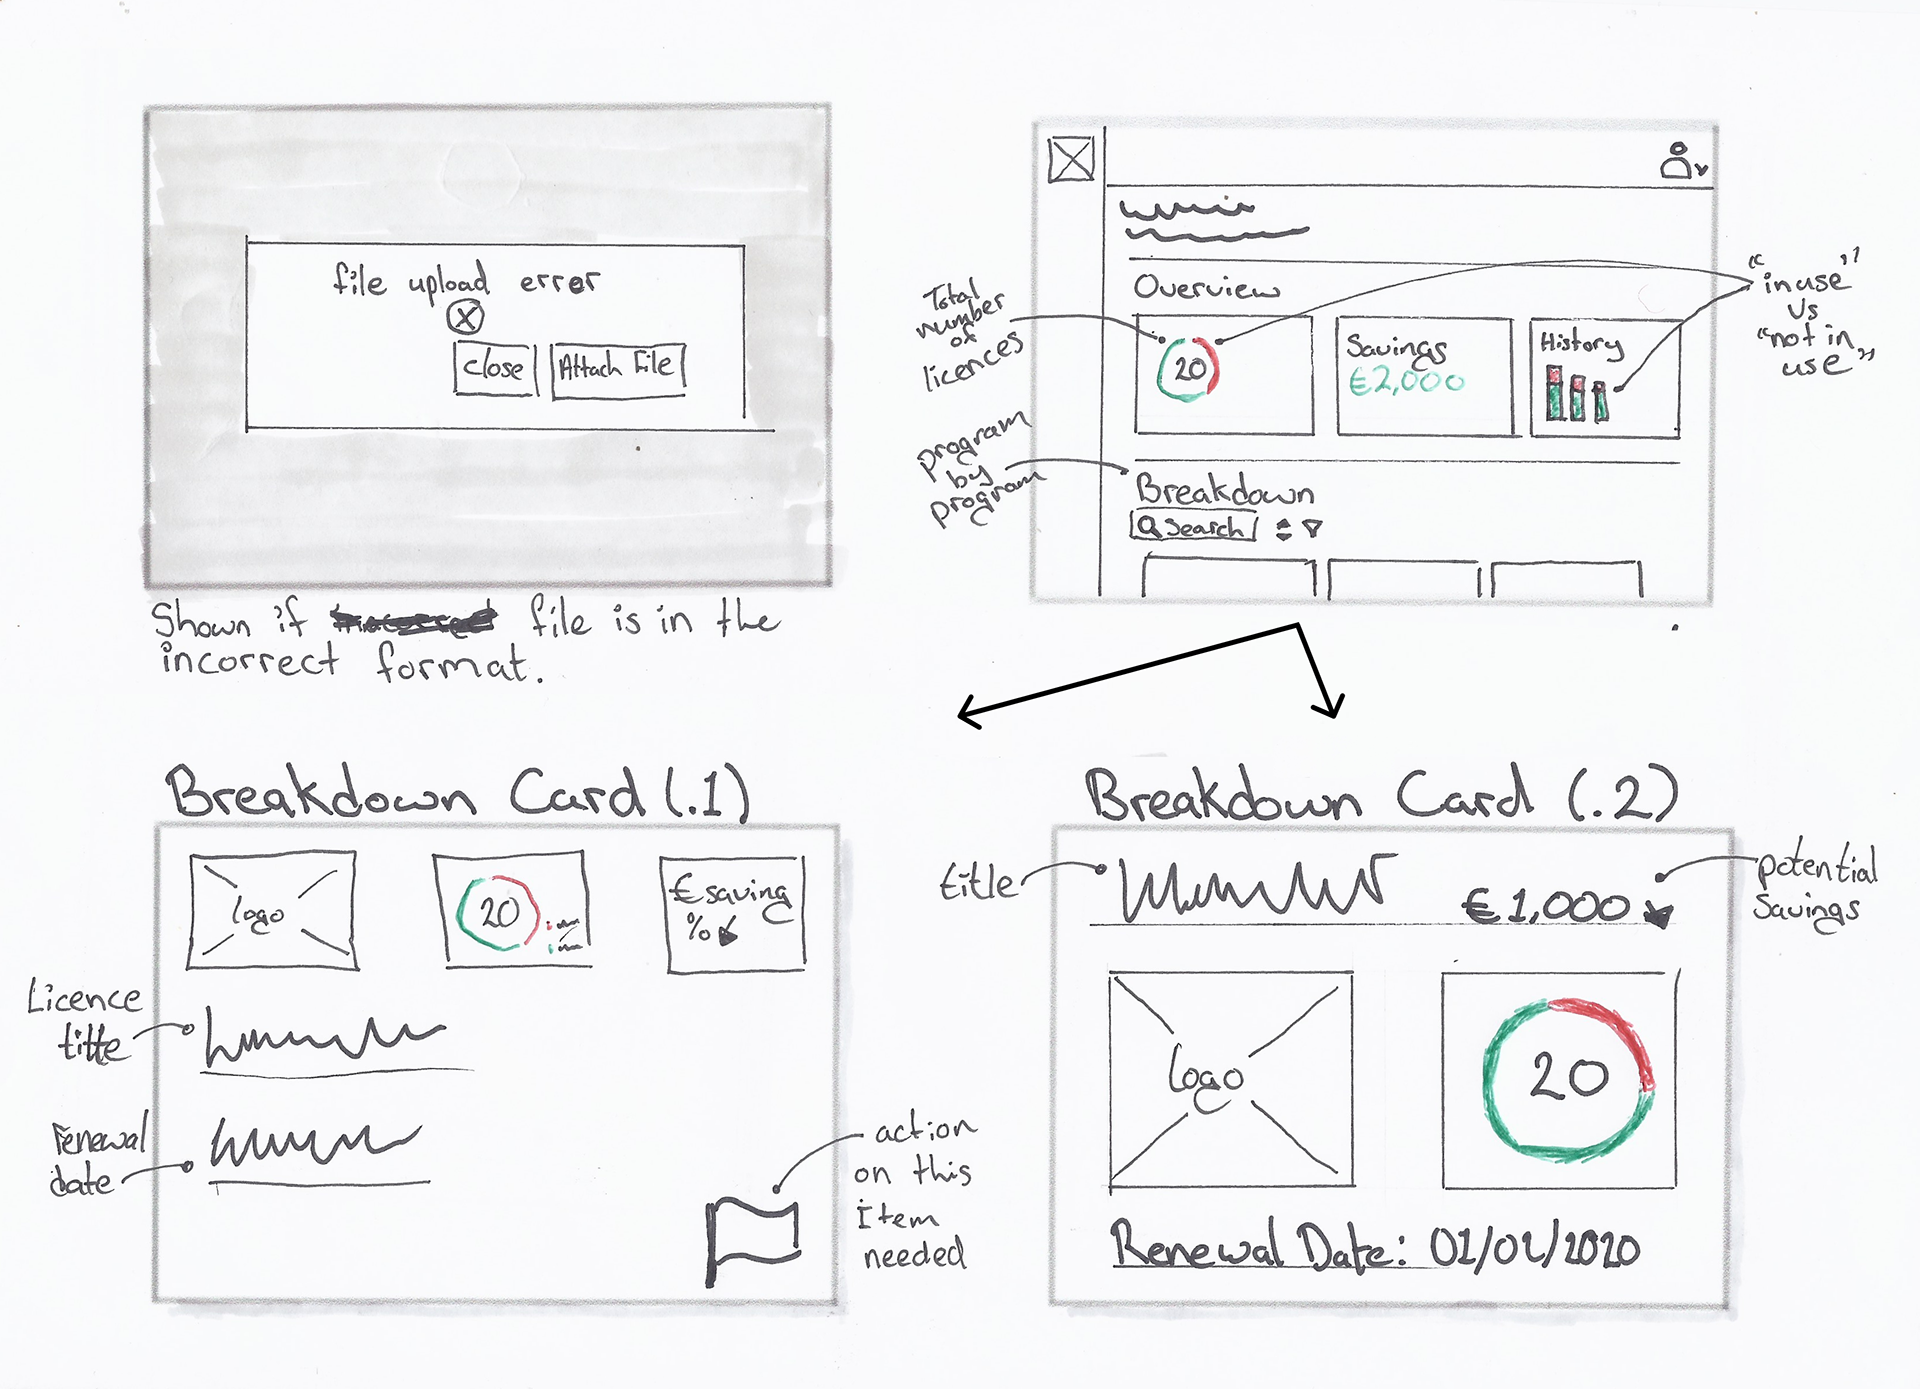
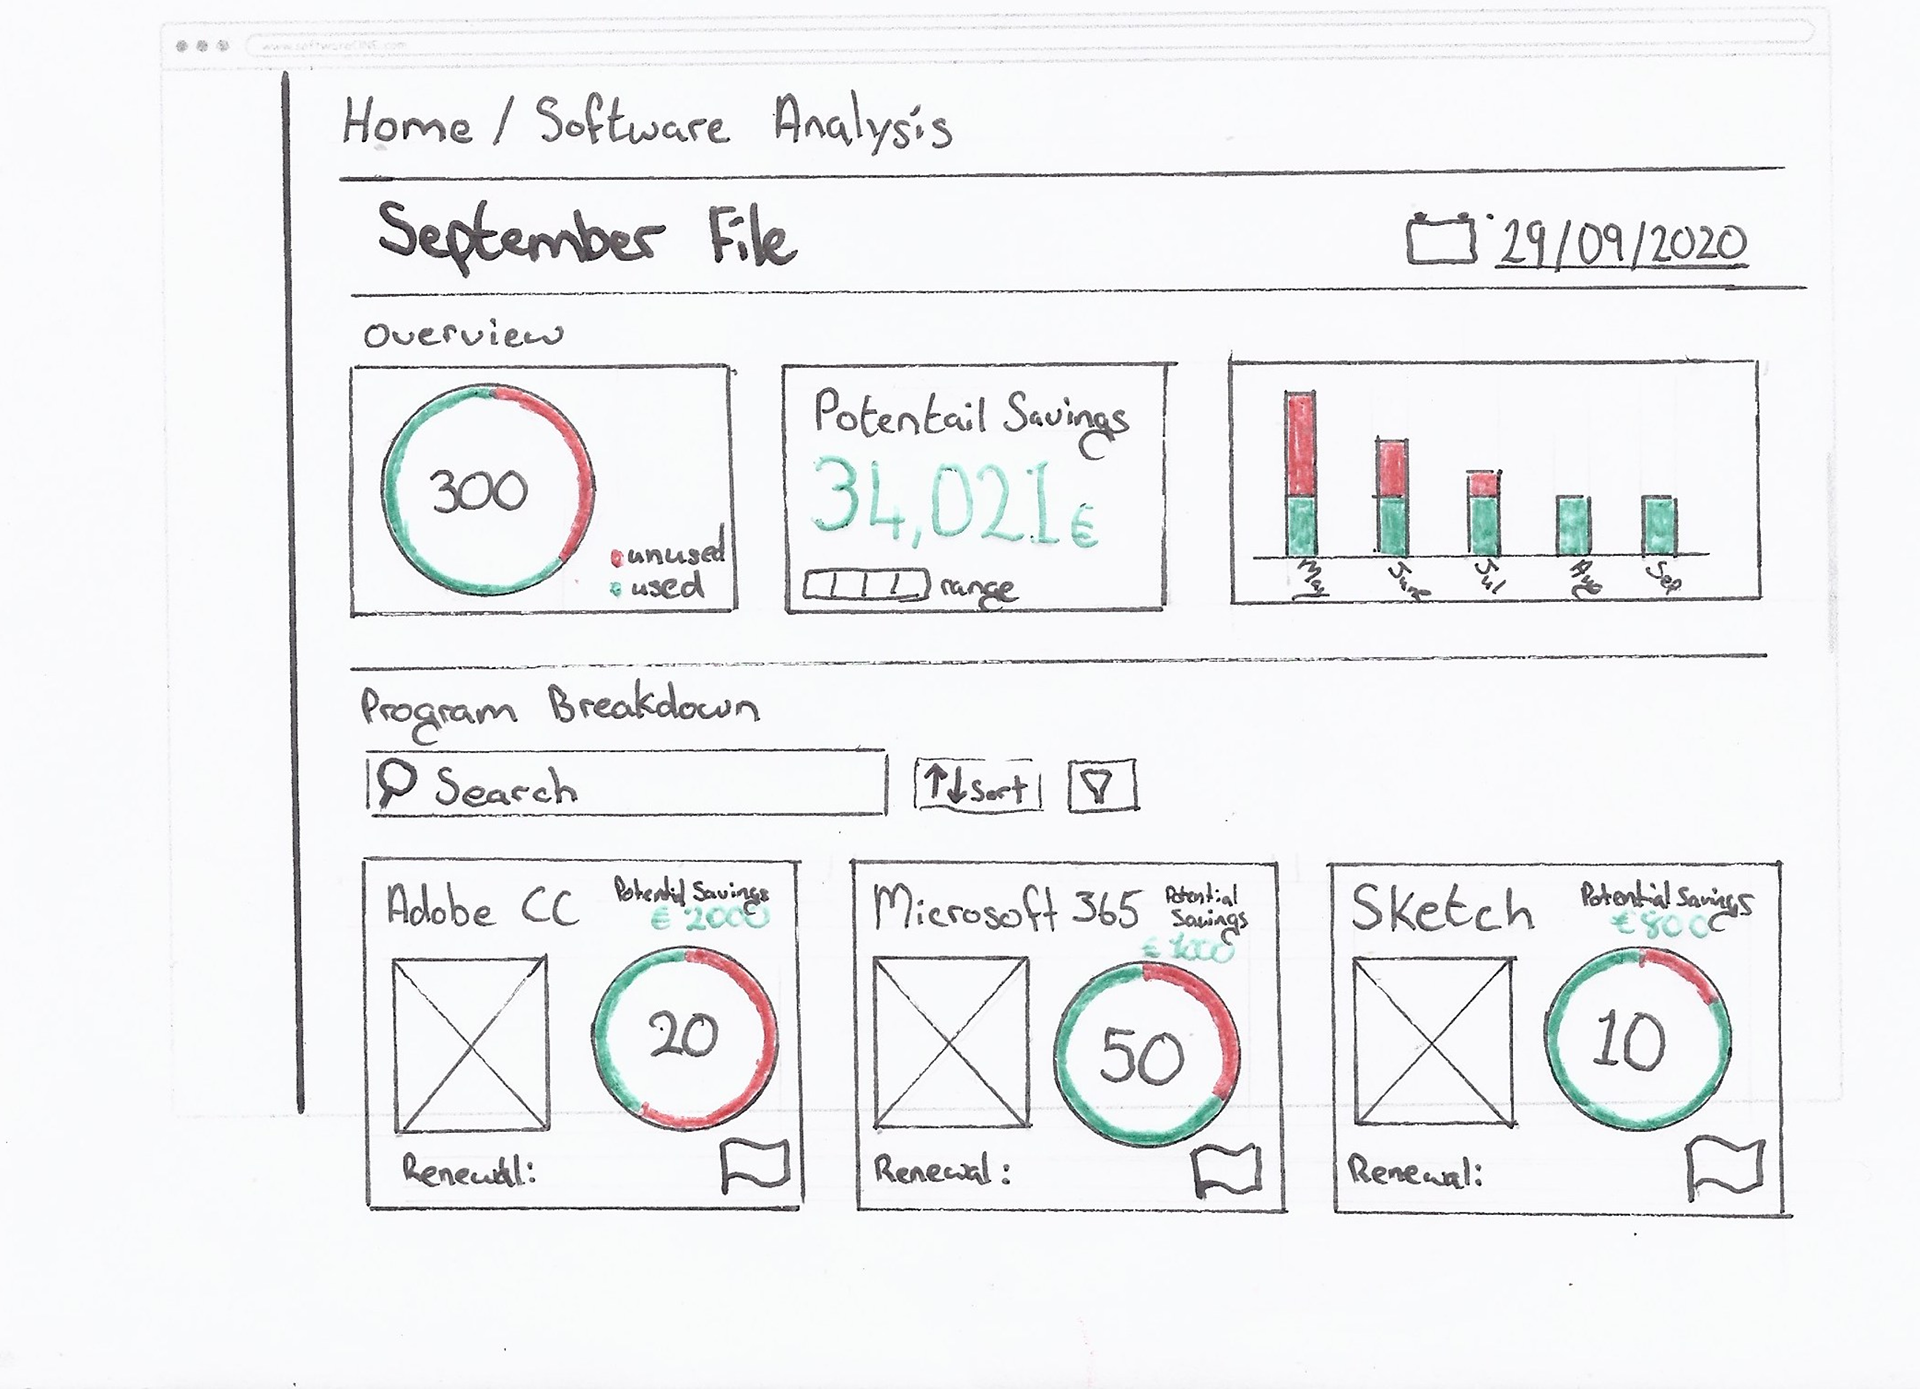
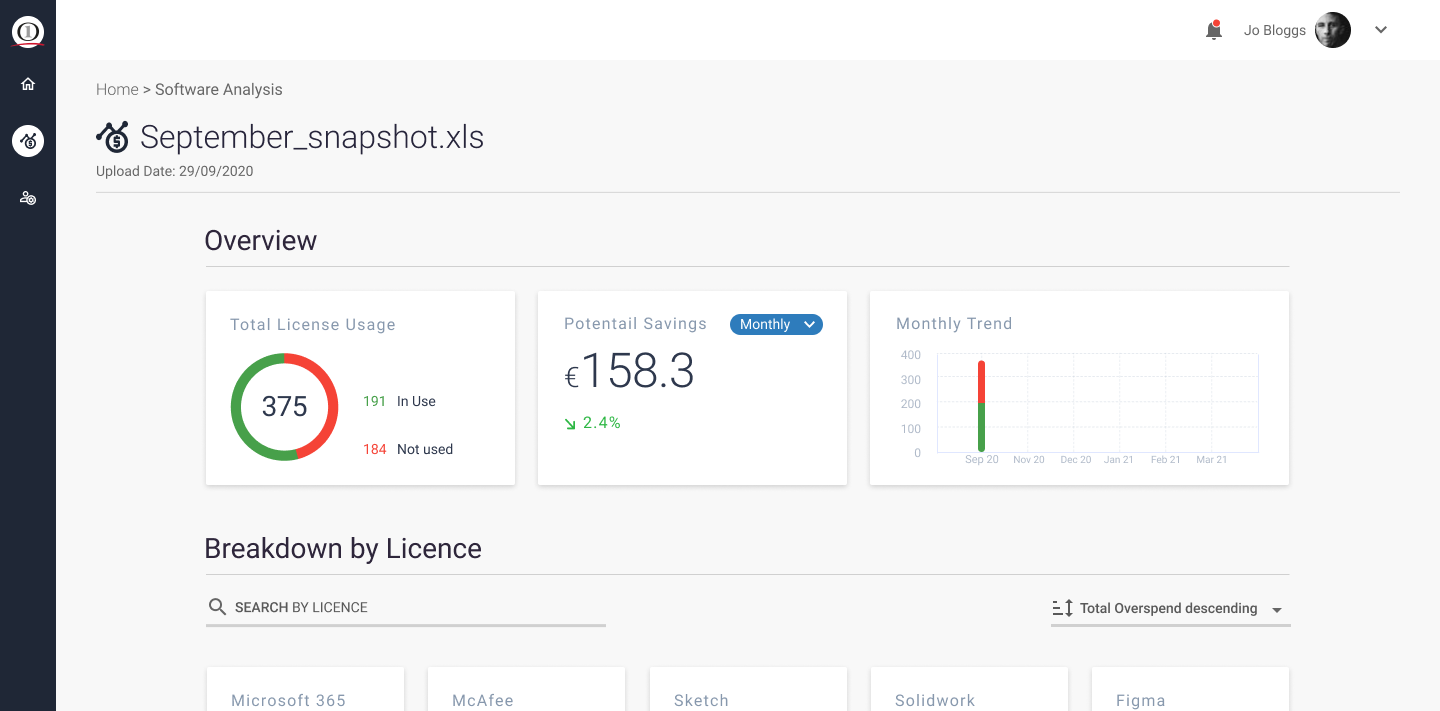
User Story 2 – As an IT Leader, who has a successful file uploaded, I am shown that the upload is successful. Then all the results are displayed on the one page in a dashboard format. Assume this is instant and loading frames are not needed. The page header displays a title matching the uploaded file name (September 2020 System Upload). Below the header section, an overview of the system upload file is displayed. The overview section contains cards detailing the uploaded file information. These cards should be as follows –
Pie chart that displays the ‘In Use’ Vs ‘Not In Use’ details of all programs.
Potential monthly savings based on removing all ‘Unused’ programs.
Chart called ‘Monthly Trend’ showing September's file upload vs other file uploads. This will be to highlight the reduction in ‘Unused’ programs across time.
Under the Overview section of the Analysis Dashboard is a program by program breakdown. One program per card. The cards should be compact and scannable. Display the program with the biggest potential savings first. There is the ability to search by program, sort by a) ‘Number of licences’ descending and ascending AND b) ‘Licences In Use’ descending & ascending.
Further assumptions
The file is uploaded immediately and a simple loader displays the progress. Therefore there is no need for a list screen to manage the uploads / view the progress of the upload.
This tool is part of a bigger web application. I should assume that there is a home page that is used to navigate to this page.
I am calling this page ‘Software Analysis”
The software analysis is done on a monthly basis by the auxiliary system. This auxiliary system provides a .xls file. The file name is based on the date of creation. This is also how the Software Analysis system segregates the uploaded files. Uploading a file with a name that already exists in the Analysis System will override the original file data.
Wireframe Development
Prototype
Enhancements
There should be a calendar input within the header to look back at older uploads.
Users should have the means of flagging a program that needs attention. This would provide an action derived from the analysis page workflow. A method of filtering flagged items would also be needed.